


Ad fraud statistics are easy to find and hard to trust. Most of the numbers circulating online date from 2019 to 2022, and the predictions in them have already expired.
These do not. Every figure below comes from the Opticks Ad Fraud Report 2025, our own analysis of real advertiser traffic, with the source and the cut stated each time.
Ten benchmarks, what each one means, and what to do about it.
Where these ad fraud statistics come from
We analysed over 2 billion clicks from 500+ advertisers and media agencies across 243 territories, between January 2025 and March 2026.
The headline metric is the invalid traffic percentage. We calculate it by dividing invalid sessions by total sessions. A session is the initial click plus a 30 minute window of activity.
A click counts as invalid when a high risk, non-contextual detection fires: automated software, device and network manipulation, bot and malware fingerprinting, or traffic from data centres and VPN products. That traffic cannot convert, or you would not want it if it did.
Ad fraud statistics by paid channel
#1: Native advertising is the dirtiest paid channel, at 15.9% invalid
Programmatic follows closely at 15.43%. Both rely on third-party inventory, where publishers get paid per impression or click. That is a direct financial incentive to manufacture traffic.
Fraudsters hide large volumes inside programmatic supply, mixed with enough real traffic to keep converting. Domain spoofing, ad stacking and unrendered ads all show up here.
#2: Social sits at 10.61% and affiliate at 9.09%
Social platforms are walled gardens. No publisher earns from that traffic, so the motive shifts: competitors and actors who want to damage a brand, rather than publishers chasing payouts.
Affiliate is different again. Fraudulent affiliates run bots from data centres and VPNs to click, fill forms and claim conversions that were never theirs.
#3: SEM is the cleanest paid channel, at 2.18% invalid
Search engine marketing beats every other paid channel by a wide margin, seven times cleaner than native.
That does not make it safe. SEM fraud comes mostly from competitors clicking your ads, and on a high CPC keyword a small percentage still costs real money. In B2B, some advertisers pay up to $50 per click.
Benchmarks are averages. Your account is not.
Opticks shows your own invalid traffic rate by channel, campaign and source, so you can compare yourself against these numbers instead of guessing.
Ad fraud statistics for traffic you did not pay for
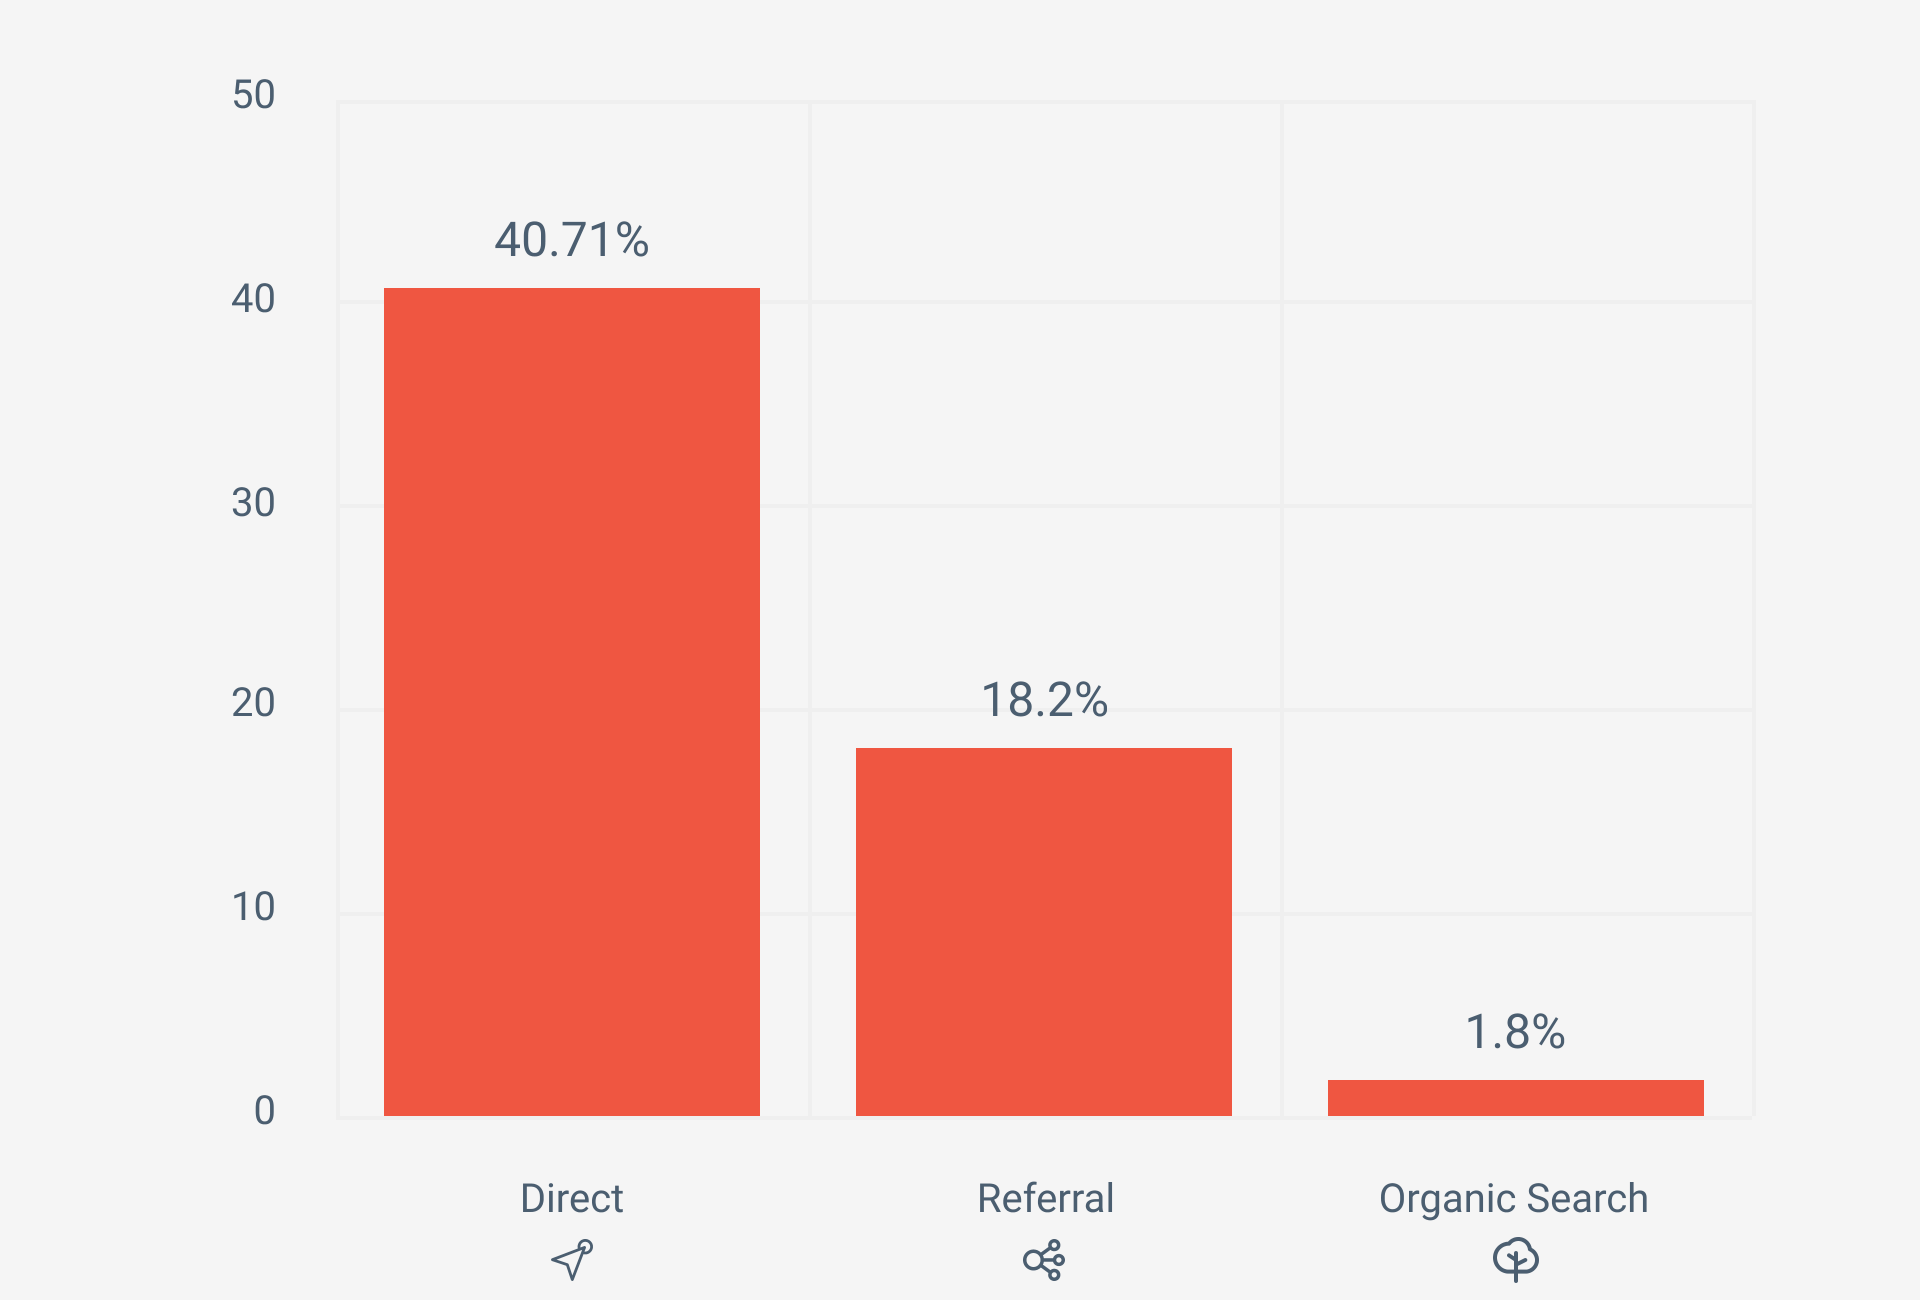
#4: Over 40% of direct traffic is invalid
Direct traffic shows 40.71% invalid, the highest rate of any source we measure.
That figure surprises most marketers. Direct means the visit arrives with no referrer and no trace of a previous step, which is exactly how scrapers behave. Competitors pulling your prices, tools harvesting your content, and automated software that never identifies itself all land in this bucket.
It costs you nothing in ad spend. It still pollutes your analytics, and scraping can damage pricing and reputation.
#5: Organic search is the cleanest source of all, at 1.8%
Referral traffic sits at 18.2%. Organic search comes in at 1.8% invalid, cleaner than every paid channel including SEM.
What the invalid traffic actually consists of
#6: Bad bots cause 54.6% of all invalid traffic
We sort detections into five threats. Across everything analysed in 2025, the split was:
- Bad bots: 54.6%. Automated software built to generate fraudulent income.
- Data tampering: 26.8%. Header manipulation, User-Agent tampering, attempts to bypass detection.
- Non-compliant traffic: 12.2%. VPNs, adult traffic, apps from outside the Play Store.
- Telemetry missing: 3.6%. Devices too old to run the script, or without JavaScript.
- Statistical anomalies: 2.8%. IPs and fingerprints producing unusual click and conversion rates.
Data tampering at more than a quarter is the number worth pausing on. That is not crude automation. Someone is actively hiding what the device really is.
#7: Nearly 9 in 10 bots are malicious
We identified 416,300,090 bots. Of those, 370,937,386 were bad bots, or 89.10%.
The other 10.9% are good bots: ad verification crawlers, uptime checkers and similar tools. They identify themselves, they do not mimic humans, and they do not click your ads. Telling the two apart is most of the work in bot detection.
Ad fraud statistics by industry and conversion type
#8: B2B carries the highest invalid rate, at 25.37%
Ad networks follow at 24.44%, then fashion and travel at 18.39%, services at 17.97%, finance at 16.52%. At the clean end sit retail at 4.36%, lead generation at 6.09% and learning at 8.46%.
High-value verticals attract fraud because the clicks are expensive. Low supply plus high customer value equals a CPC worth stealing.
#9: Nearly half of invalid lead-gen conversions come from bots
Conversion type changes the picture completely. Across a sample of 500,000 conversions:
- Lead generation: 46.7% bad bots, 40.5% non-compliant, 12.7% data tampering.
- E-commerce: 18.3% bad bots, 81.7% non-compliant, 0% data tampering.
A payment gateway stops bots. A form does not. If your conversion is an email address, you are the softer target, and those fake leads reach your sales team.
What these ad fraud statistics cost you
#10: No prevention means 11% lower ROAS and 9% higher CAC
Ad fraud costs advertisers roughly $84 billion worldwide. The number that matters more is the one in your own account.
Our research found that companies without a prevention function run an 11% lower ROAS and a 9% higher CAC than those with one. We covered how prevention moves those two metrics in detail.
Across our client base, recovered spend typically lands between 3% and 20% of total ad budget.
What to do with these ad fraud statistics
Benchmarks tell you what normal looks like. They do not tell you where you sit.
Three things follow from the numbers above:
- Weight your attention by channel. Native and programmatic deserve far more scrutiny than SEM.
- Check direct traffic, even though it is free. At 40.71% invalid, it is distorting the analytics you plan campaigns with.
- Treat form conversions as the weak point. Lead generation is where bots convert, and the techniques keep changing.
Then measure your own traffic. An average built from 500 advertisers tells you nothing about which of your campaigns is bleeding.
Free 7-day trial
Find out which of these numbers is yours
Connect in five minutes through Google Tag Manager and watch your invalid traffic appear in real time. No developer, no credit card.
4.9/5 on G2 and Capterra · 6,000+ businesses protected · €6M+ in ad spend recovered
Want the full dataset? Download the Opticks Ad Fraud Report, or see the case studies.
Comments
7 responses to “10 Key Ad Fraud Benchmarks You Need to Know”
[…] Bad bots alone caused 54.6% of all the invalid traffic Opticks flagged in 2025, more than any other threat type tracked. See the full breakdown in our ad fraud benchmarks. […]
[…] To protect your key KPIs: The combination of wasted ad spend, missed targets, and skewed analytics adds up to a hugely reduced return on investment. Our own data shows ad fraud can cause an 11% reduction in return on ad spend (ROAS) and a 9% increase in customer acquisition cost (CAC). See the full picture in our ad fraud benchmarks. […]
[…] Ad fraud prevention solutions like Opticks help you detect leaky advertising operations and fraudulent partners, and help you invest your ad spend wisely in legitimate advertising. Combined with a full ad fraud prevention function, advertisers can improve their ROAS by an average of 11%. See the full breakdown by industry and channel in our ad fraud benchmarks. […]
[…] Opticks’ real-time anti-ad fraud solution detects and blocks invalid clicks before they eat into your budget. Our 2025 Annual Ad Fraud Report found that bad bots alone caused over half of all the invalid traffic Opticks flagged last year, which is exactly the kind of traffic a Google Ads refund claim can’t catch in time. See the full picture in our ad fraud benchmarks. […]
[…] At Opticks, we protect your organization from complex domain spoofing attacks with our proprietary algorithms and custom telemetry, so you don’t fall victim to the effects of domain spoofing ad fraud. See the full threat breakdown in our ad fraud benchmarks. […]
[…] Anti-fraud SaaS solutions specialize in protecting PPC campaigns against competitors clicking on Google Ads, along with many other ad fraud techniques. They’re the only complete way to stop budget-draining clicks and keep your campaigns running the way they’re meant to. Ultimately, anti-fraud solutions help you get a higher ROAS (return on ad spend), lower customer acquisition costs (CAC), and cleaner data out of your Google Ads campaigns. See the full breakdown in our ad fraud benchmarks. […]
[…] By filtering out illegitimate traffic, Opticks gives you confidence that fraud has been caught before it can damage your campaigns. See the full threat breakdown in our ad fraud benchmarks. […]