

How to identify bot traffic in Google Analytics (GA4)
To identify bot traffic in GA4, look for a high-volume, low-engagement Direct channel, session durations clustered near 0 seconds, bounce rates stuck at 0% or 100%, traffic from countries you don’t serve, and clicks or sessions that spike without a matching rise in conversions. GA4’s built-in filtering only removes traffic from a known-bots list — it misses most of what’s actually costing advertisers money.
Why bot traffic in Google Analytics slips past native filtering
GA4 does exclude some bot traffic automatically, using the IAB/ABC International Spiders and Bots List. That list covers traffic that declares itself as a bot — search engine crawlers, monitoring services, known scrapers. It was never built to catch traffic that’s specifically engineered to look human: residential proxies, click farms, headless browsers spoofing real user agents, or bots targeting your paid campaigns rather than your organic pages.
That’s the gap both GA4 and manual spreadsheet checks share: they can flag obvious anomalies after the fact, but they have no mechanism to classify a session in real time, and no connection back to your ad platforms to stop paying for the click that created it.
Across the accounts behind the Opticks Ad Fraud Report 2025, 416,300,090 bot sessions were detected out of 2 billion clicks analysed — 89.10% of them malicious, not legitimate crawlers GA4 would already exclude.
The checklist
7 signs of bot traffic in Google Analytics (GA4) reports
1. Direct traffic is unusually high
GA4 buckets anything it can’t attribute — including most bots, since they rarely carry referrer or UTM data — into Direct. If that channel looks big for a brand your size, and engagement on it is weak, that’s usually where to start looking.
2. Session duration near zero
Averages won’t show this. Plot session duration as a distribution instead of an average, and you’ll often find a cluster of sessions under 1-2 seconds — landing and leaving almost instantly, which isn’t really how people browse.
3. Bounce rate at the extremes
A channel or campaign sitting at exactly 0% or 100% engagement rate, week after week, is more suspicious than a merely high or low number. Real human traffic is messy; a perfectly flat one usually means a script.
4. Geographic mismatches
Meaningful volume from countries you don’t sell into, don’t ship to, or don’t run ads in. To be fair, legitimate crawlers and CDNs can cause some of this too, so it’s worth cross-checking against your actual targeting before jumping to conclusions.
5. Traffic spikes without conversions
Sessions or ad clicks rise sharply, conversions don’t move. This is the pattern behind both bot traffic and click fraud, for the same reason: the volume isn’t real, so it was never going to convert.
6. Identical device/browser fingerprints
A lot of sessions sharing the exact same browser, OS, and screen resolution — or running old browser versions almost nobody uses anymore — usually means something scripted or emulated, not a crowd of different people.
7. Ad clicks don’t match GA4 sessions
Pull the clicks Google Ads or Meta Ads reported for a campaign and compare them to sessions that actually landed in GA4 for the same dates. If there’s a consistent gap, you’re paying for clicks that never became a real session.
None of these on its own proves anything — Direct traffic can be legitimately high, bounce rate swings for boring reasons, geography is never perfectly clean. It’s when two or three line up on the same channel that it stops being a coincidence.
Step-by-step: check for bot traffic in Google Analytics today
You can run this with the GA4 property you already have, in about 15 minutes:
- Check Direct traffic volume and behaviour.Reports > Acquisition > Traffic acquisition, isolate the Direct row. High volume with a low engagement rate is your first flag.
- Segment engagement rate by channel.In the same report, compare engagement rate and average engagement time across every channel — look for one channel that stands out as unnaturally flat.
- Build a session-duration histogram.Explore > Free form, plot session duration as a distribution (not an average). Look for a spike near 0 seconds.
- Add geography as a dimension.Reports > User attributes > Demographic details > Country/City. Flag volume from markets you don’t operate in.
- Overlay traffic against conversions over time.Look for spikes in sessions or clicks with no matching rise in your conversion events.
- Check Tech details.Look for an outsized share of one browser/OS/device combination, especially older versions.
- Cross-reference with Google Ads/Meta Ads.Pull clicks per campaign from the ad platform and compare against GA4 sessions for the same campaign and date range.
If two or more of these show up on the same channel or campaign, you’re very likely looking at invalid traffic — and GA4 has already shown you everything it’s going to show you. It can’t tell you which individual sessions were bots, and it can’t claw back the ad spend.
Real data, not a hypothetical
What bot-heavy traffic actually looks like
Most articles on this topic describe bot traffic in Google Analytics in the abstract. Across the 2 billion clicks analysed for the Opticks Ad Fraud Report 2025, Direct traffic came out as the most bot-heavy non-paid channel by a wide margin — one of the clearer early signs of ad fraud worth watching for:
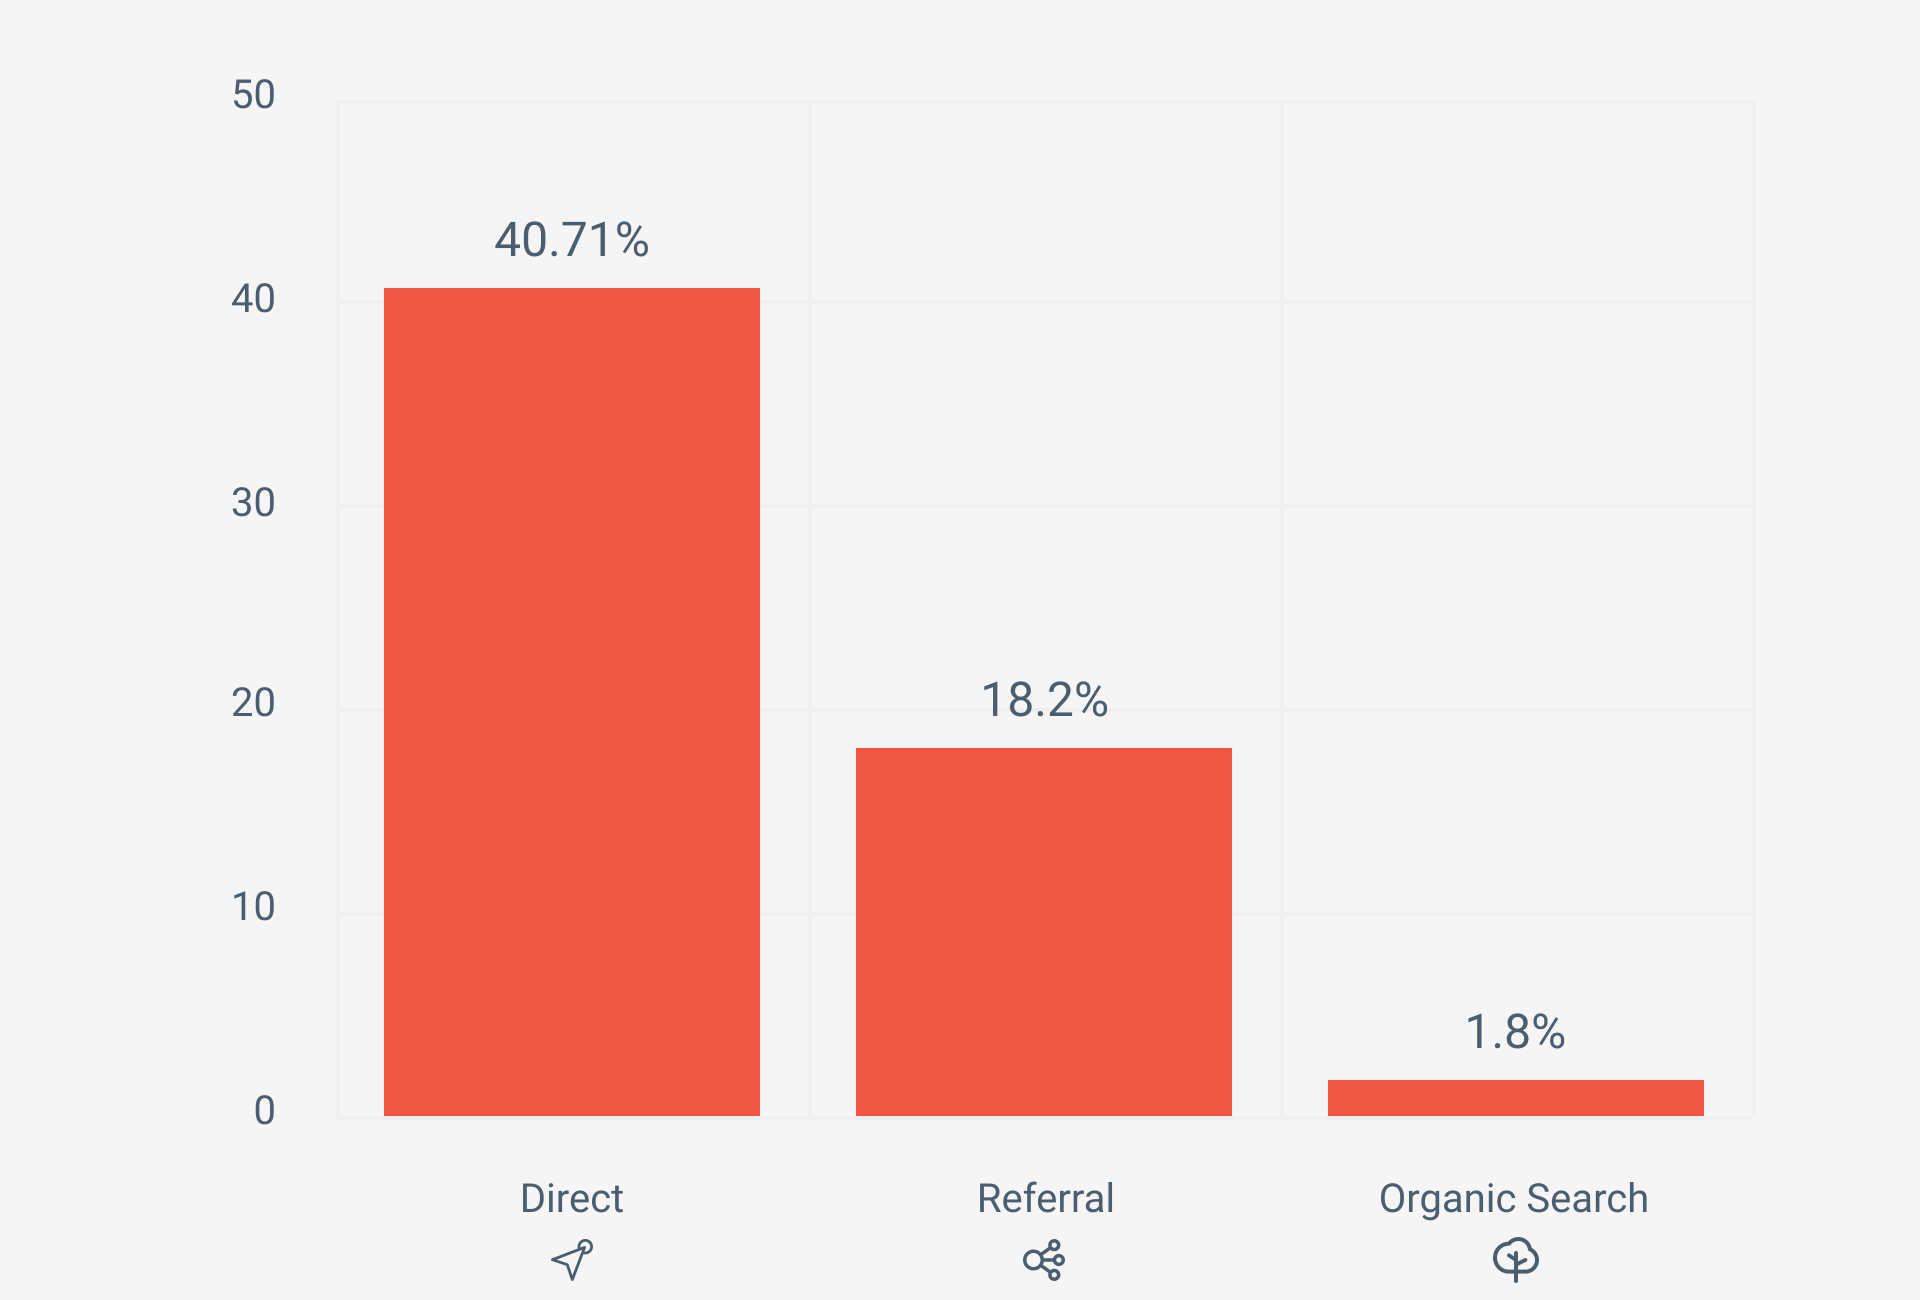
Source: Opticks Ad Fraud Report 2025 — invalid-traffic rate for non-paid channels, based on 2 billion clicks analysed across 500+ advertisers.
That’s the industry-wide picture. Here’s what it looks like on one real account: Opticks’ own live traffic classification for August 2026, one full month, human-only sessions vs. total sessions per channel.
| Channel | Total sessions | Legitimate (human) | % invalid |
|---|---|---|---|
| Direct | 172,187 | 689 | 99.6% |
| Meta (Facebook, Instagram) | 45,094 | 0 | 100% |
Source: Opticks internal traffic classification, August 2026. Figures show human-verified sessions only (GIVT/SIVT and good bots excluded); Opticks’ own “legitimate sessions” panel total for the same month (204,324) is higher because it also counts good bots, which are non-fraudulent but not real users either.
Notice the Direct row: 172,187 sessions, and only 689 — 0.4% — were an actual human, a far more extreme split than the report’s own 40.71% average — which is exactly the point: the industry number is a floor, not a ceiling. Breaking that invalid share down further: 62,367 were known bots (generic good bots and Googlebot), 10,703 were flagged as bad bots, 7,972 showed data tampering, and 3,539 were non-compliant traffic — on top of the rest of the invalid-traffic categories. Meta shows a different failure mode entirely: not high volume, just zero legitimate sessions for the entire month. Two different bot patterns, on the same account, in the same month — which is exactly why a single rule of thumb (“check your bounce rate”) isn’t enough.
Where manual GA4 checks break down for click fraud specifically
Everything above works for spotting bot traffic after it’s already in your reports. It doesn’t work for click fraud on paid campaigns, for three structural reasons:
- No real-time decision. GA4 shows you what happened yesterday or last week. Fraudulent clicks need to be caught and excluded within the bid/billing window, not discovered in a report days later.
- No connection to ad spend. GA4 has no concept of “this click cost €4.20 and should be refunded or excluded.” Identifying the pattern in GA4 doesn’t get a single euro back from Google or Meta.
- No automatic exclusion list. Even once you’ve spotted a fraudulent IP, device, or placement, GA4 can’t push that exclusion back into your ad platforms. Someone has to do it manually, campaign by campaign, which doesn’t scale past a handful of campaigns.
This is the exact gap Opticks is built to close: real-time SIVT/GIVT classification on every click before it’s billed, automatic negative-IP and exclusion-list pushback into Google Ads and Meta Ads, and session-level forensics so you can see precisely which sessions were fraudulent — not just infer it from an aggregate bounce rate.
FAQ
Bot traffic in Google Analytics: quick answers
Does GA4 filter out bot traffic automatically?
Partially. GA4 automatically excludes traffic matching the IAB/ABC International Spiders and Bots List — known, declared crawlers. It does not catch sophisticated or malicious bots, residential-proxy traffic, click farms, or bots built specifically to evade known-bot lists, which is most of the traffic that actually costs advertisers money.
How do I identify bot traffic in GA4?
Look for unusually high or spiking Direct traffic with low engagement, session durations clustered near 0 seconds, extreme bounce-rate patterns on a single channel, traffic from countries you don’t operate in, unusual concentrations of one browser/OS/device combination, and traffic or click volume that rises without a matching rise in conversions.
Why is my Direct traffic so high in Google Analytics?
Direct is GA4’s default bucket for sessions it can’t attribute to a known source — including most bot and invalid traffic, since bots typically don’t carry referrer or campaign data. A high, low-engagement Direct channel is one of the most reliable bot signals in GA4; in Opticks’ own August 2026 data, Direct was 99.6% invalid traffic.
Can Google Analytics detect click fraud?
Not directly. GA4 was built to measure engagement, not to police ad clicks, so it has no concept of a “fraudulent click” and can’t automatically exclude invalid clicks from your ad platform billing. It can only surface indirect symptoms — like a traffic spike with no matching conversions — that someone still has to notice and investigate manually.
What percentage of website traffic is bots?
Industry-wide estimates put bot traffic at roughly a third to half of all internet traffic. Across the Opticks Ad Fraud Report 2025, 416,300,090 bot sessions were detected out of 2 billion clicks analysed, and 89.10% of those bots were malicious rather than legitimate crawlers.
Stop guessing from bounce rates. See it session by session.
Free Opticks traffic scan — 5 minutes to set up, real numbers on your real campaigns.
Free trial · no credit card required · cancel anytime
Leave a Reply